Anyone familar with ABI--- architecture billing index? Here see the attached, you will find ABI chart from 2000 to July of 2010. Currently, It looks ABI still stay in the up trend, similar to what we have in 2001. Beginning from 2001, US economy gradually out of the 9-11 and high tech bubble recession, and grow into a 7 year boom.
we are one of the firms who contributes to that index. to me, it has a limited perspective and extrapolates a whole lot of data from a very narrow set of questions.
regardless, there won't be another repeat 'boom', construction wise, here in the u.s. over the next 7 years. it seems to have hit a bottom (whether or not it's THE bottom is beyond me) and we'll see some stabilization and small growth overall the next few years. however, we won't re-absorb the large numbers laid off, nor will we be able to absorb the multitudes graduating UNLESS we figure out new and different ways to expand our business models.
The world experienced one of the greatest building booms ever and yet during 2004-2007 did wages really rise? Did architect's fees really go up proportionally? Did any of us gain any ground? My guess is any gains architectural workers saw during the "boom" went towards $4.00 gas to get to work.
"The world experienced one of the greatest building booms ever and yet during 2004-2007 did wages really rise? Did architect's fees really go up proportionally? Did any of us gain any ground?"
That's a really, really good point.
Did anyone price gouge?
I mean the whole idea of a supply-demand open market is that prices fluctuate based on supply and demand. I suppose developers did but did the AEC industry as a whole gouge prices?
Did firms jump up their billing two- three-fold when inquiries started pouring in?
I think it's important to note that, at the end of a recession, labor productivity growth increases rapidly (value of output over value of labor put into achieve that output). This is because employers are employing fewer people at the point demand begins to recover.. so those people work longer hours, more productively, given that new hiring is still cautious and inevitably lags demand recovery...
... which means, hopefully, employment will start growing again 6 to 9 months after the beginning of recovery in the index. Either that or, pessimistically, and if fear and uncertainty prevail, the output recovery may never translate into jobs growth at all (and output falls in a subsequent period).
If I'm reading the graph correctly, the ABI seems to be showing an significant increases across the region beginning in May and June, 2010. By this logic, we should start seeing some real arch firm employment activity by January or February, 2011, assuming the recovery proves sustainable.
urbanist: although you are right that there was an uptick in May and June, the overall index is still below 50. According to the full ABI report the score has to be above 50 to indicate growth. So technically billings are still declining.
can you explain what the left hand side of the chart shows? if the abi is the blue line, then a .5 or 50% represents a 'treading water only' position. in that sense, the chart doesn't waver too much but is on a constant decline (i don't think most people 'get' the abi. like i mentioned above, we participate in it monthly and it took me 3 months to really absorb what it communicates).
what the surveys ask is: 'are your net billings higher last month than the previous month' yes, no, same. repeat for job inquiries. also ask about which project types you think are up/down in an area and in your own practice.
so, if the billings index is just measuring 'actuals' from the standpoint of it's in a decline month over month, it's not saying much that most of us don't already know. however, the way the question is asked (above), it doesn't, for me, translate into how much of a decline. if i responded, say, 'declined' one month, it doesn't ask by what % (i don't think - it's late). a 1% decline is far different than 10% month over month. yet on the graph, it would look far more catastrophic.
point being, granularity matters and the survey isn't really set up that way right now.
The new AIA billing index is out and it's showing a flat trend just above 50 at 50.6 marking continued stagnation. Buried in the Architect's Newspaper report was the line, "a quarter of all firms surveyed (24 percent) received some form of revenue resulting from the American Recovery and Reinvestment Act" which made me wonder if the billings index is indeed heavily weighted towards large, government connected firms. I have never met another Architect working on stimulus related work nor seen enough recovery projects to justify a quarter of all firms. Can we rely on the billings index to be a realistic indicator of our activity?
There's two issues with the Architecture Billings Index: it's voluntary and it's voluntary. It's not a blind-type random assignment survey. Firm owners and principals can opt into the board to report, compare and analyze data from others firms nationally and locally.
Typically, when your firm enrolls, you get an e-mail the first week of every month to report your data. This assumes that you care enough to do it, have the time to do it and that your firm actually does its paperwork monthly. Respondents can estimate their monthly billings if they do not do accounting regularly.
In 2005, roughly 300 firms actively participated in the survey. The Billings Index is supposed to reflect firms that primarily offer architectural services but a number of firms in the index also offer engineering, design, interior design, construction management and pre-design.
It's calculated as a diffusion with a score of 50 being a median "no-change" value-- it's a combination of figures from firms responding to a question of whether or not they've seen increases in billings, have seen no increase in billings or decrease in billings.
So that 50.6 score represents the percentage all of the firms reporting increased plus half of firms reporting no increase. The 'increase' itself is measure as a 5% change in billings. Since most businesses grow at rates of 1-3% on average, a 5% change is relatively significant.
The draw back, however, is that the score can be construed many ways. For instance, 80% of firms could be reporting no increase with only 10.6% of firms reporting an increase.
There's also an interesting lag with the ABI. About 40-65% of projects take between 6 months to a year to get a contract award from the design phase. Depending on how billings reporting is actually taking place within a firm, that score of 50.6 could actually represent work started in September or April of last year. It generally equals out to about a 5 month lag.
The ABI for the Northeast and the South generally paint the most accurate view of the overall economy. In addition, architecture main clients are about 40-50% institutional and 30-40% commercial and industrial. In the early parts of the 2000s, institutional billings grew roughly 3-5% annual through the entire period where as commercial billings plummeted declining as much as 5-10% on average a year. So, certain firms were posting record profits while other firms were shuttering the doors.
It's highly likely that the opposite will happen in the coming years due to budget cuts and a stricter focus on tax policy. But, in either case, the ABI won't necessarily tell you that from looking at a figure that just says "50.8."
You can obviously see what kind of hurdle this might be for a smaller outfit. Talking about how great your firm is something that people like office managers, financial managers and marketing coordinators do full-time. So, many firms simply don't have the resources to accurately and consistently publish reports about their companies financial picture. They might not even be aware that they can participate in the ABI because they don't have someone they pay to surf the internet all day long. Typically, because of stipulations involving accountability and public record, companies that do government work run a tighter ship and have to collect and publish this data frequently to avoid the General Accountability Office from bum-rushing their offices.
Nothing worse than an accountant with federal agent police powers!
Apr 20, 11 3:48 am ·
·
Block this user
Are you sure you want to block this user and hide all related comments throughout the site?
Archinect
This is your first comment on Archinect. Your comment will be visible once approved.

architecture billing index(ABI): does it really reflect the economy
Anyone familar with ABI--- architecture billing index? Here see the attached, you will find ABI chart from 2000 to July of 2010. Currently, It looks ABI still stay in the up trend, similar to what we have in 2001. Beginning from 2001, US economy gradually out of the 9-11 and high tech bubble recession, and grow into a 7 year boom.
Do you agree with me or the chart?
This link would be better to see what is going on.
http://www.architectmagazine.com/economic-conditions/abi-report.aspx
we are one of the firms who contributes to that index. to me, it has a limited perspective and extrapolates a whole lot of data from a very narrow set of questions.
regardless, there won't be another repeat 'boom', construction wise, here in the u.s. over the next 7 years. it seems to have hit a bottom (whether or not it's THE bottom is beyond me) and we'll see some stabilization and small growth overall the next few years. however, we won't re-absorb the large numbers laid off, nor will we be able to absorb the multitudes graduating UNLESS we figure out new and different ways to expand our business models.
The world experienced one of the greatest building booms ever and yet during 2004-2007 did wages really rise? Did architect's fees really go up proportionally? Did any of us gain any ground? My guess is any gains architectural workers saw during the "boom" went towards $4.00 gas to get to work.
"The world experienced one of the greatest building booms ever and yet during 2004-2007 did wages really rise? Did architect's fees really go up proportionally? Did any of us gain any ground?"
That's a really, really good point.
Did anyone price gouge?
I mean the whole idea of a supply-demand open market is that prices fluctuate based on supply and demand. I suppose developers did but did the AEC industry as a whole gouge prices?
Did firms jump up their billing two- three-fold when inquiries started pouring in?
Thanks you for the post.
Hi guys, Im a newbie. Nice to join this forum.
__________________
Watch Takers Online Free
I think it's important to note that, at the end of a recession, labor productivity growth increases rapidly (value of output over value of labor put into achieve that output). This is because employers are employing fewer people at the point demand begins to recover.. so those people work longer hours, more productively, given that new hiring is still cautious and inevitably lags demand recovery...
... which means, hopefully, employment will start growing again 6 to 9 months after the beginning of recovery in the index. Either that or, pessimistically, and if fear and uncertainty prevail, the output recovery may never translate into jobs growth at all (and output falls in a subsequent period).
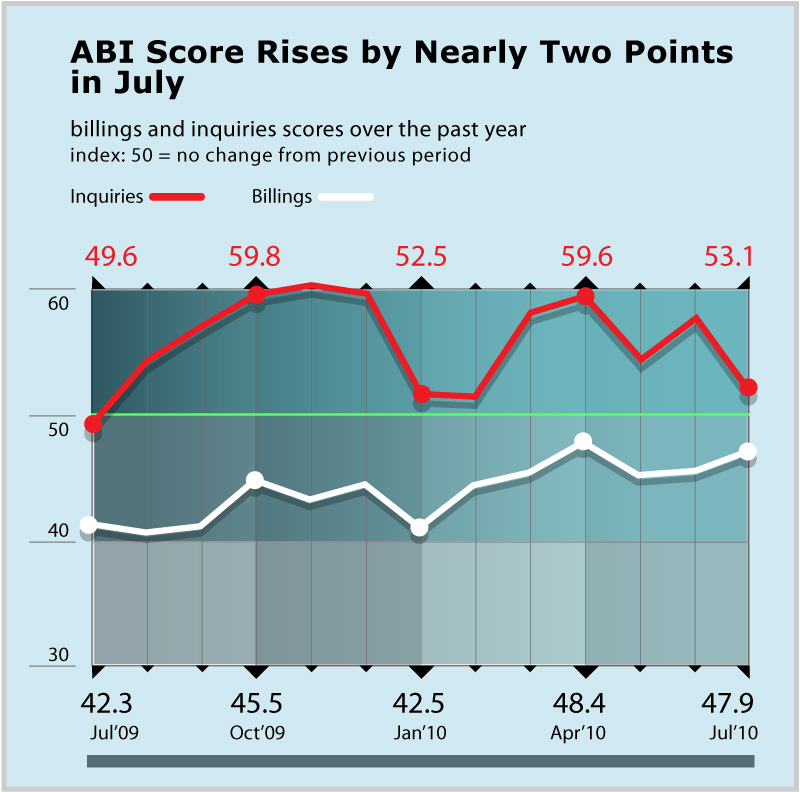
If I'm reading the graph correctly, the ABI seems to be showing an significant increases across the region beginning in May and June, 2010. By this logic, we should start seeing some real arch firm employment activity by January or February, 2011, assuming the recovery proves sustainable.
Urbanist: u are wrong for abi. But I don't know how to post an image here. This forum is the only one I can't post an image easily. Damn.
cmrhm:
is this the chart you are referring to?
urbanist: although you are right that there was an uptick in May and June, the overall index is still below 50. According to the full ABI report the score has to be above 50 to indicate growth. So technically billings are still declining.
gresham : I want to post a real billing chart. Do I need to host on another website and link to here?
Pls tell me how to post an image here.
Yes, I think you have to link it from another site. See the code below the "post a response" box.
Sorry.

here it is:
Sorry.

here it is:
Damn it. I can't delete it. If this time is not successful, I won't continue.

Sorry, guys, I totally screwed up.

But Did you guys the real billing? It is almost 0 comparing to 08.
bigger is better

hard to control the scale. This forum just like construction industry --- lack of fund...
cmr - thanks for taking the time to try.
can you explain what the left hand side of the chart shows? if the abi is the blue line, then a .5 or 50% represents a 'treading water only' position. in that sense, the chart doesn't waver too much but is on a constant decline (i don't think most people 'get' the abi. like i mentioned above, we participate in it monthly and it took me 3 months to really absorb what it communicates).
what the surveys ask is: 'are your net billings higher last month than the previous month' yes, no, same. repeat for job inquiries. also ask about which project types you think are up/down in an area and in your own practice.
so, if the billings index is just measuring 'actuals' from the standpoint of it's in a decline month over month, it's not saying much that most of us don't already know. however, the way the question is asked (above), it doesn't, for me, translate into how much of a decline. if i responded, say, 'declined' one month, it doesn't ask by what % (i don't think - it's late). a 1% decline is far different than 10% month over month. yet on the graph, it would look far more catastrophic.
point being, granularity matters and the survey isn't really set up that way right now.
sorry - on the graph, both a 1% decline and a 25% decline would register the same - equally down.
Does ABI for this month come out yet?
Upcoming Press Release Dates for 2010:
September 22
October 20
November 17
December 22
Hi, I'm newbie..maybe in future, i'll need your help!
--------------------
Game over
The new AIA billing index is out and it's showing a flat trend just above 50 at 50.6 marking continued stagnation. Buried in the Architect's Newspaper report was the line, "a quarter of all firms surveyed (24 percent) received some form of revenue resulting from the American Recovery and Reinvestment Act" which made me wonder if the billings index is indeed heavily weighted towards large, government connected firms. I have never met another Architect working on stimulus related work nor seen enough recovery projects to justify a quarter of all firms. Can we rely on the billings index to be a realistic indicator of our activity?
There's two issues with the Architecture Billings Index: it's voluntary and it's voluntary. It's not a blind-type random assignment survey. Firm owners and principals can opt into the board to report, compare and analyze data from others firms nationally and locally.
Typically, when your firm enrolls, you get an e-mail the first week of every month to report your data. This assumes that you care enough to do it, have the time to do it and that your firm actually does its paperwork monthly. Respondents can estimate their monthly billings if they do not do accounting regularly.
In 2005, roughly 300 firms actively participated in the survey. The Billings Index is supposed to reflect firms that primarily offer architectural services but a number of firms in the index also offer engineering, design, interior design, construction management and pre-design.
It's calculated as a diffusion with a score of 50 being a median "no-change" value-- it's a combination of figures from firms responding to a question of whether or not they've seen increases in billings, have seen no increase in billings or decrease in billings.
So that 50.6 score represents the percentage all of the firms reporting increased plus half of firms reporting no increase. The 'increase' itself is measure as a 5% change in billings. Since most businesses grow at rates of 1-3% on average, a 5% change is relatively significant.
The draw back, however, is that the score can be construed many ways. For instance, 80% of firms could be reporting no increase with only 10.6% of firms reporting an increase.
There's also an interesting lag with the ABI. About 40-65% of projects take between 6 months to a year to get a contract award from the design phase. Depending on how billings reporting is actually taking place within a firm, that score of 50.6 could actually represent work started in September or April of last year. It generally equals out to about a 5 month lag.
The ABI for the Northeast and the South generally paint the most accurate view of the overall economy. In addition, architecture main clients are about 40-50% institutional and 30-40% commercial and industrial. In the early parts of the 2000s, institutional billings grew roughly 3-5% annual through the entire period where as commercial billings plummeted declining as much as 5-10% on average a year. So, certain firms were posting record profits while other firms were shuttering the doors.
It's highly likely that the opposite will happen in the coming years due to budget cuts and a stricter focus on tax policy. But, in either case, the ABI won't necessarily tell you that from looking at a figure that just says "50.8."
I hope that helps.
You can obviously see what kind of hurdle this might be for a smaller outfit. Talking about how great your firm is something that people like office managers, financial managers and marketing coordinators do full-time. So, many firms simply don't have the resources to accurately and consistently publish reports about their companies financial picture. They might not even be aware that they can participate in the ABI because they don't have someone they pay to surf the internet all day long. Typically, because of stipulations involving accountability and public record, companies that do government work run a tighter ship and have to collect and publish this data frequently to avoid the General Accountability Office from bum-rushing their offices.
Nothing worse than an accountant with federal agent police powers!
Block this user
Are you sure you want to block this user and hide all related comments throughout the site?
Archinect
This is your first comment on Archinect. Your comment will be visible once approved.